AUTHOR: GAGAN CHOUDHARY | SANDEEP VIJAY
INTRODUCTION
- The 3161 cm-1 mid infra red spectral feature, over the years, has evolved as an important tool amongst gem labs in identification of unheated sapphires, especially from low-iron metamorphic environment such as Sri Lanka.
- This mid infra red spectral feature is a series of bands, composed of a strong peak at ~3161 cm-1, with weaker side bands at ~ 3075, 3240, 3355 cm-1, together termed as 3161 cm-1-series, and are assigned to structurally bonded OH, associated with defects, created by Mg2+ (Smith and Van der Bogert, 2006) and/or Si4+ (Volynets et al, 1972).
- This 3161cm-1-series is more commonly observed in natural-color yellow to orange and padparadscha sapphires (Smith and Van der Bogert, 2006) than any other color of corundum, although this is occasionally encountered in blue and pink sapphires along with some rubies from Winza (Schwarz et al, 2008).
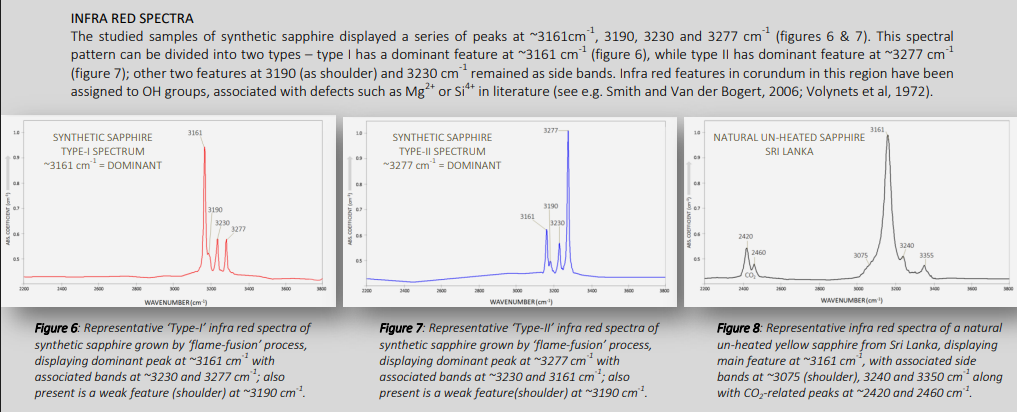
- These authors however have encountered a strong feature at ~3161 cm-1 in few specimens of synthetic yellow sapphire grown by flame-fusion (Verneuil) process whose identity was established using gemological testing and inclusion study. Study of spectral features suggests a difference in position of bands associated with 3161cm-1 feature.
- Occasional encounter of 3161cm-1 feature and lack of inclusions in synthetic light-colored sapphires may pose challenges in its identification, and for this reason, these authors present a comparative infra red features associated with 3161cm-1-series of natural and synthetic sapphires.
MATERIALS AND METHODS
SAMPLES
The studied 17 samples in the weight range from 2.15 to 121.27 ct were submitted individually at different times, for identification at the Gem Testing Laboratory, Jaipur, India without any prior information. All these transparent yellow samples were identified as corundum on the basis of their RI of ~1.760-1.770 and hydrostatic SG of ~3.98-4.00. Their inclusions and growth patterns along with transparency under short-wave UV suggested them to be synthetic, grown by flame-fusion (Verneuil) process.
EQUIPMENT USED
In addition to the standard equipment used for measuring gemological data, infra red spectra was recorded using a Shimadzu IR Prestige 21 (FTIR) spectrometer at room temperature with a diffused reflectance accessory, in the 400–7000 cm-1 range at resolution of 4 cm-1 and 50 scans; the spectra obtained were then converted into absorption spectra using the software. Although the data was recorded in 400-7000cm-1 range, the range with OH absorptions i.e. 2200-3800cm-1 is presented here.
RESULTS
INCLUSION FEATURES
- The most obvious features visible in these samples were gas bubbles which ranged from spherical to bomb-shaped to pinpoints (figure 1). Many of the samples also displayed clouds of pinpoints and/or minute gas bubbles in circular or curved pattern (figure 2). All these features are associated with synthetic gems grown by the flame-fusion process (e.g. Gübelin and Koivula, 1997).
- One specimen (2.15 ct) displayed straight milky zones (figure 3), as usually seen in natural sapphires, thereby making the identification much more challenging; these milky zones appeared to be composed of much finer sub-microscopic pinpoints, similar to rutile dust commonly observed in sapphires from Sri Lanka or Madagascar.
- When viewed in the optic axis direction, under crossed-polarizers, these samples also displayed a characteristic ‘plato-effect’ (figure 4), which provided evidence of their synthetic flame-fusion origin (e.g. Choudhary, 2008).
SHORT-WAVE UV TRANSPARENCY
In addition to the inclusions, the samples were further confirmed as synthetic by their transparency under short-wave ultraviolet light (figure 5), the test which is proved to be quite useful in identification and separation of synthetic light-colored flame fusion sapphires from natural counterparts (e.g. Choudhary & Golecha, 2008).
DISCUSSION
- Synthetic sapphires studied here displayed infra red bands at ~3161, 3190, 3230 and 3277 cm-1, where in some samples the 3161 cm-1 band was dominant, while in some 3277cm-1 band (figures 6 and 7). Whereas, the ~3161 cm-1-series in natural sapphires (figure 8) is composed of main feature at ~3161 cm-1, with associated side bands at ~3075, 3240 and 3350 cm-1 along with CO -related peaks at ~2420 and 2459 cm-1 (see e.g. Smith and Van der Bogert, 2006).
- Volynets et al (1972) have reported 3161cm-1 peak along with bands at ~3275 and 3420 cm-1 (latter being absent in our samples) in synthetic corundum grown by Verneuil process. Bands at ~3275 and 3420 cm-1 are found even in pure crystals (i.e. without admixtures), suggesting that these bands are not related to impurities, but to cation vacancies which form during synthesis.
- Cation vacancies (acting as traps for hydrogen ions) get associated with tetravalent admixtures (such as Si, Ti or V), if present. Hence, when concentration of admixture increases, number of admixture-related vacancies also increases and number of isolated vacancies decreases.
- Volynets et al (1972) have also illustrated that the corundum admixed with SiO2, displayed features at ~3160, 3240 (~3230) and 3275 cm-1, while synthetic corundum with impurities such as MgO, TiO2, V2O5 or even pure crystal (without admixtures) lacked the feature at ~3160cm-1. It is also showed that in a single crystal, with areas having higher concentration of SiO2 impurity, 3161 cm-1 band is stronger than the 3275cm-1 band, and vice versa.
- Beran and Rossman (2003) have also assigned spectral features at ~3185 (~3190), 3230 and 3310 cm-1 in synthetic Verneuil corundum to cation vacancies, with weak bands at ~3160 and 3280 (~3277) cm-1, specifically for colorless to light rose-colored corundum.
- Kronenberg et al (2000) have reported peaks at ~3163 and 3278 cm-1 in their hydrothermally annealed specimens, but failed to link them definitely to other associated defects.
- Smith and Van der Bogert (2006) suggests the cause of 3161cm-1-series in natural yellow-to-orange and padparadscha sapphire to be Mg2+ related trapped-hole centers associated with structurally bonded OH. However, Hughes (2017) mentions ‘Punisiri-type’ infra red spectra consisting of a series of bands at ~2490, 2626, 3064 and 3191 cm-1, in magnesium-doped synthetic corundum, incorporated with hydrogen, which is in agreement with that illustrated by Volynets et al (1972) in synthetic corundum admixed with MgO.
CONCLUSION
- Separation and identification of synthetic light-colored corundum from natural counterparts can be done on the basis of inclusion study, growth features (such as ‘plato-effect’) along with short-wave UV transparency.
- OH-related infra red feature at ~3161 cm-1 is widely used to determine natural origin as well as unheated nature of yellow to orange and padparadscha sapphires, but one has to be careful, since a similar feature is occasionally observed in light-colored synthetic corundum too.
- In absence of conclusive inclusions and/or growth features or presence of straight milky zones as illustrated in figure 3, identification should not only be based on the presence of ~3161 cm-1 band, but also the position of associated bands.
REFERENCES
Beran A., Rossman G.R. (2006) OH in naturally occurring corundum. Eur. J. Mineral, Vol. 18, pp 441-447. DOI: 10.1127/0935-1221/2006/0018-0441
Choudhary G., Golecha C. (2008) Shortwave UV Transparency – a useful test for light coloured corundum. https://www.gem-passion.com/uv-transparency; last accessed: 11-09-2018
Choudhary G. (2008) An interesting synthetic sapphire. Gems & Gemology, Vol. 44, No. 1, pp 87-88
Gübelin E.J., Koivula J.I. (1997) Photoatlas of Inclusions in Gemstones, 3rd edn. ABC Edition, Zurich, Switzerland
Hughes R.W. (2017) Ruby & Sapphire – a gemologist’s guide. RWH Publishing/Lotus Publishing, Thailand
Kronenberg A.K., Castaing J., Mitchell T.E., Kirby S.H. (2000) Hydrogen defects in α-Al2O3 and water weakening of sapphire and alumina ceramics between 600 and 1000oC- Infrared characterization of defects. Acta Materialia, Vol. 48, pp 1481-1494
Smith C.P., Van der Bogert C. (2006) Infrared spectra of gem corundum. Gems & Gemology, Vol.42, No.3, pp 92-93
Schwarz D., Pardieu V., Saul J.M., Schmetzer K., Laurs B.M., Giuliani G., Klemm L., Malsy A., Erel E., Hauzenberger C., Du Toit G., Fallick A.E., Ohnenstetter D. (2008) Rubies and sapphires from Winza, central Tanzania. Gems & Gemology, Vol. 44, No. 4, pp. 322–347.
Volynets F.K., Sidorova E.A., Stsepuro N.A. (1972) OH groups in corundum crystals which were grown with the Verneille technique. Zhurnal Prikladnoi Spektroskopii, Vol. 17, No. 6, pp 1088-1091